Alignment
The alignment of the spectrometer should be checked before acquiring any data.
Note
The part references used in this section refer to components in the Transient Absorption Spectrometer Reference Design. Components and layout can vary widely between different time-resolved spectrometers, but many parts will have equivalents and the fundamental steps are likely still be relevant.
White-light Continuum (Probe)
The quality of the white light is critical to obtaining good data. It is worth spending some time ensuring that the probe is stable and as high quality as possible.
Delay Line Passes
The aim of this step is to ensure the seed beam for the probe enters and exits the delay line along
a straight path with no deviation as the delay is moved along its range. To help with this, the
aligncam plugin module should be loaded, and an
appropriate alignment camera (AC) connected.
Select the Align tab on the main window. You should now be viewing the seed laser spot as
seen on a screen by the alignment webcam.
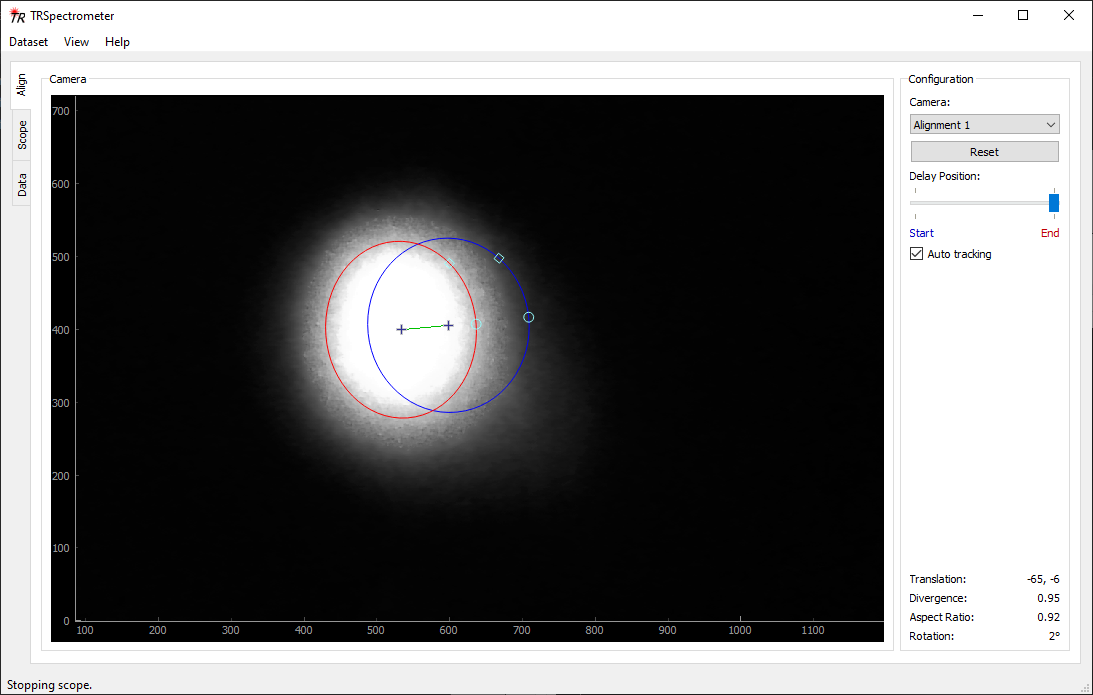
Alignment panel indicating poor alignment through the delay line. The blue and red ellipses should be overlapping when there is no beam deviation due to the delay movement.
If multiple cameras are connected, select the correct one using the Camera combo box. If a
camera has been disconnected or reconnected while the application is running, try using the
Reset button to reinitialise the cameras.
The blue ellipse on the plot tracks the position of the spot when the Delay Position slider is
in the blue Start position, the red ellipse tracks the position when the slider is in the red
End position. When the Auto tracking checkbox is checked, the positions will be updated
automatically using a computer vision algorithm. In manual mode, the ellipses can be moved, resized
and reshaped using the handles. If a delay is attached and functioning, changing the Delay
Position slider will also cause the delay to move to the start and end of its extremes. If a delay
is not connected or not functional, the laser spot tracking will still switch between the two
ellipses. Depending on the specific hardware, you may still be able to move the delay manually to
see the effects.
Using the Delay Position slider, run the delay to the start position, and then to the end
position. The blue ellipse will now designate where the laser spot was at the start of the delay,
and the red ellipse will be currently tracking the position of the spot (at the end of the delay).
The statistics in the lower-right corner will indicate how the laser spot has changed over the
length of the delay. We ideally want to the two spots to be identical (no translation, 1.0
divergence factor, 1.0 aspect ratio change, no rotation).
In the above image, there is significant deviation which needs to be corrected. The basic procedure is:
Adjust the mirror directing the seed into the delay line (M1), and observe the effect on the screen. To begin with, try moving the mirror so that the red ellipse is on top of the blue ellipse.
Move the delay position to the start, and then back to the end.
Note if your mirror adjustment improved things. If so, repeat the above steps until the two ellipses are co-incident at both the start and end positions. You may find you need to “overshoot” the adjustment a fraction to finish the last bit of alignment. If your adjustment made things worse, try again, perhaps only adjusting the horizontal or vertical deflection until you figure out what’s going on.
It is likely you won’t ever be able to get the alignment perfect, but get it as good as you can. If you’re having problems, check that the beam is not getting clipped off at the edge of any mirrors or similar.
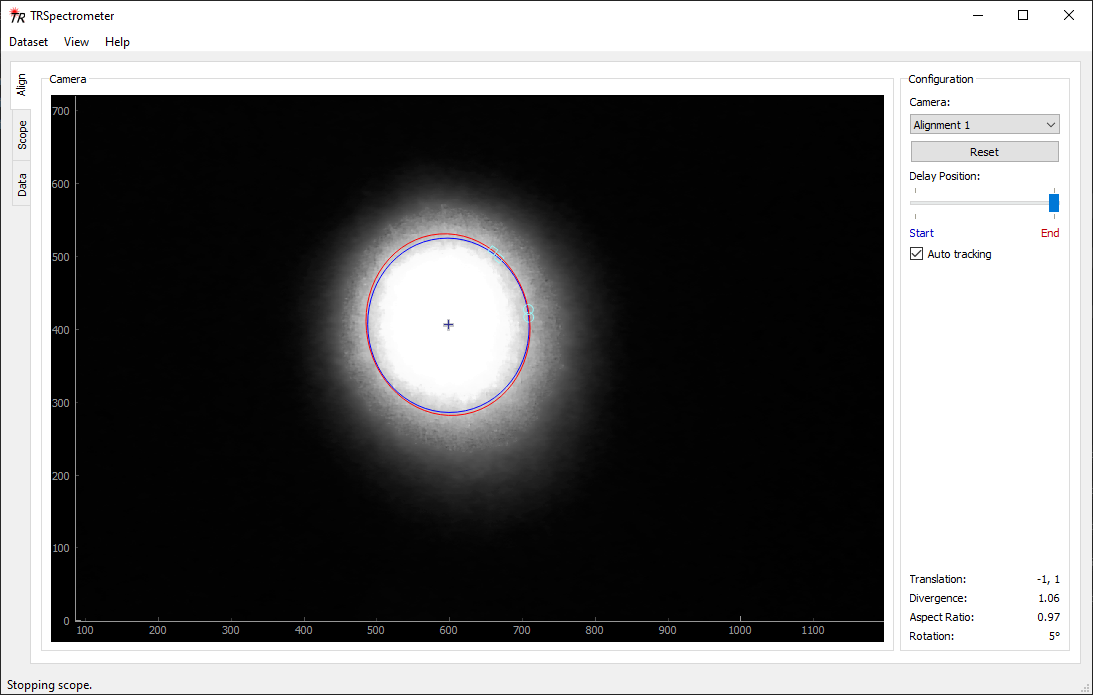
Alignment panel after correct adjustment of beam through the delay line.
Continuum Generation
Check that a continuum is being generated in the white-light generation medium (WLG) using a white card. The light should be a single, stable spot. Adjust the position of the medium using the micrometer stage and intensity of the seed beam using the wave plate (WP1) if necessary.
Pulling a good continuum can be a little bit of a black art, so some trial-and-error may be needed. For a sapphire WLG medium, the best stability tends to be found using an intensity somewhat high relative to where the continuum is first established. For a deuterium oxide (D2O, heavy water) medium however, the optimal intensity is only a little higher than where the continuum is first seen. An excessive intensity and/or high laser repetition rates will cause bubbles to form which will destroy the continuum generation.
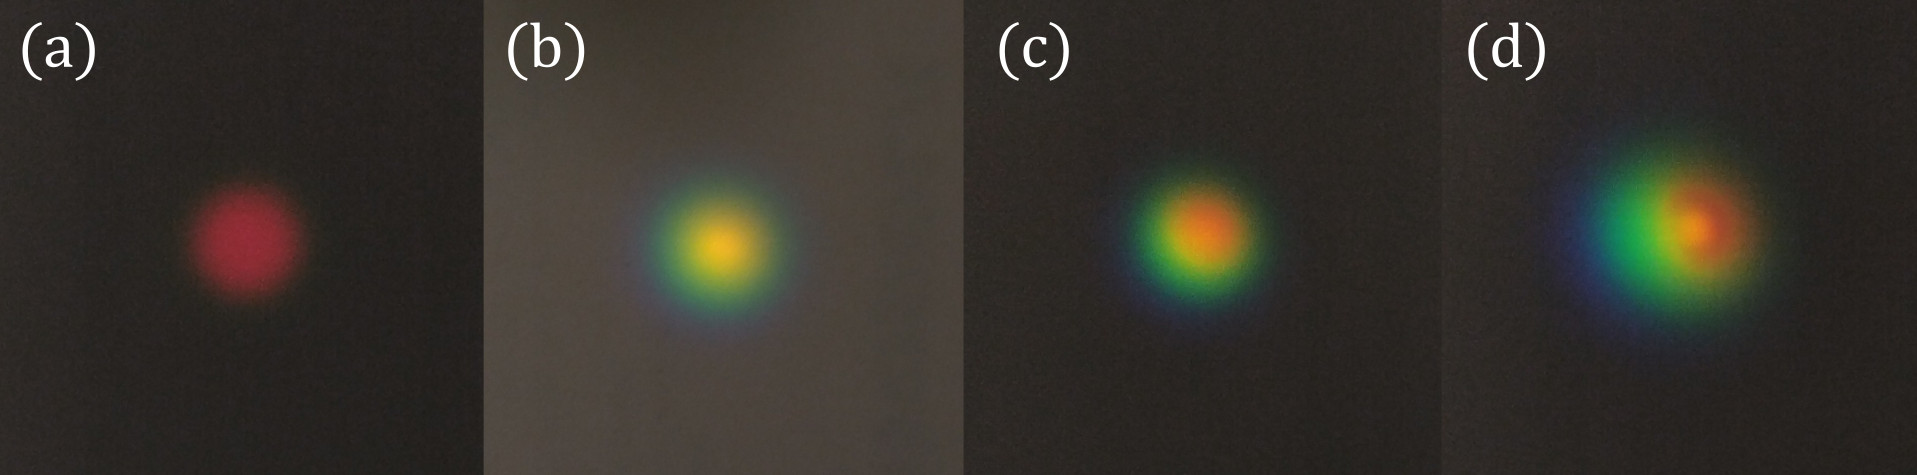
Photographs of white light continua seen on a white business card, produced using different intensities of the seed laser. The WLG medium was a 12 mm sapphire crystal. The seed was 1030 nm, with approximately 160 fs pulse duration and 1 µJ pulse energy, focussed onto the medium using a f = 300 mm lens. In (a), the pulse energy is just high enough to produce light, but will not be useful as a probe. The continuum in (b) looks almost perfect, but using a slightly higher intensity (c) may give better results. When too high intensity is used, the continuum will start to break up and produce additional filaments, such as in (d).
Focus on the Sample
Immediately after the white-light generation (WLG) medium is a concave mirror (CM1) which collects the diverging continuum and begins focussing it down on the sample. Adjust the position of this mirror using its micrometer stage so that the size of the spot at the sample position is as small as possible.
Placing a piece of black anodised aluminium at the sample position will help with determining the size of the spot by eye. If your sample is in a cuvette, note that the sample position will actually be a millimeter or so behind the front face of the cuvette.
Open up the iris (I1) immediately after the sample, and then check that the white light is centred on the target iris (I2) just before the detector. Adjust the concave (CM1) and/or steering (M5) mirrors if necessary. If a large adjustment is made, go back and check that the focus at the sample position is still as tight as possible. Open up I2 completely when alignment is complete.
Ensure the white light passes cleanly through any filters (F1) which may be in place between the WLG and the sample. Finally, close down the iris (I1) directly after the sample. If the white light does not pass cleanly through this, adjust the position of the iris (this iris is to block the residual pump, it is not an alignment target!).
Aim into Detector
The Scope panel allows viewing of the raw detector data to assist with this alignment step.
The scope plugin module needs to be loaded for the
panel to appear.
Select the Scope tab on the main window, and ensure that Raw mode is selected. The raw
spectrum being detected by the detector hardware will be displayed in the plot area.
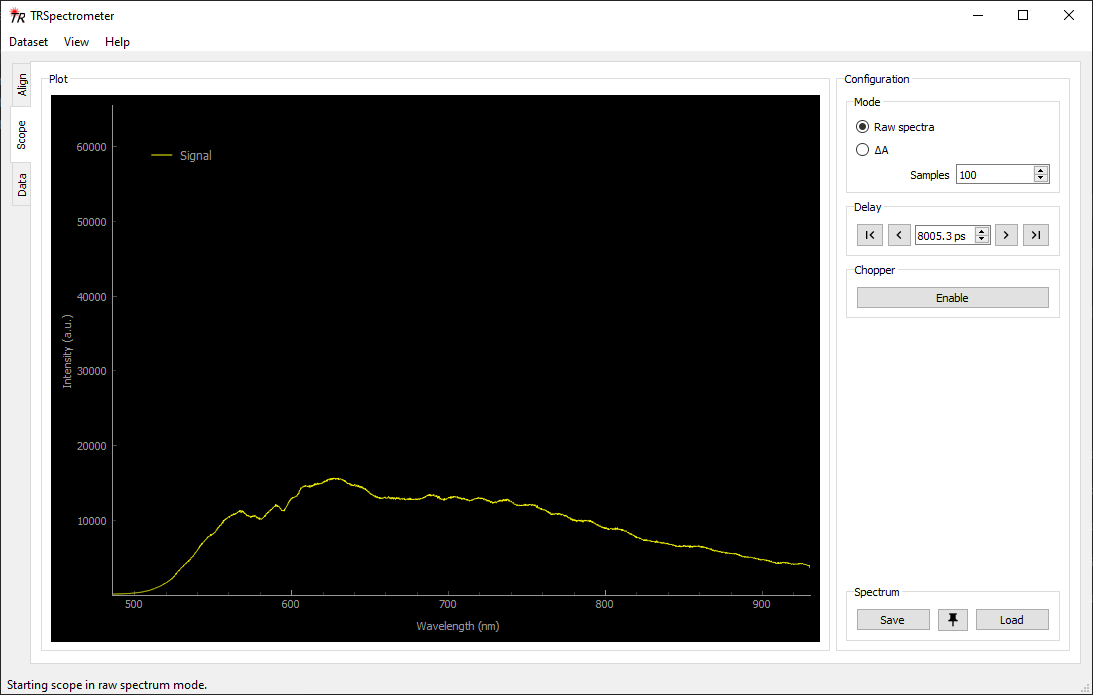
Scope panel showing the raw white light spectrum being detected by the detector.
Adjust the steering mirror (M7) before the detector to maximise the intensity and bandwidth of the displayed spectrum. The position of the focussing lens (L2) may also need optimising if the character or alignment of the white light has changed significantly.
Check Delayed Spectrum
The character of the white light can change over the course of the delay due to deviation or divergence of the seed beam. In the extreme case, the continuum can completely fail from one end of the delay to the other. This should be checked and the white light generation adjusted to minimise this effect if required.
The scope panel has some features to assist with this step. Use the delay \(|\lt\) and \(\gt|\) controls to run the delay through to one extreme. Click the pin button to temporarily pin the current spectrum to the plot, then run the delay to the opposite extreme. Any changes in the spectrum should become obvious.
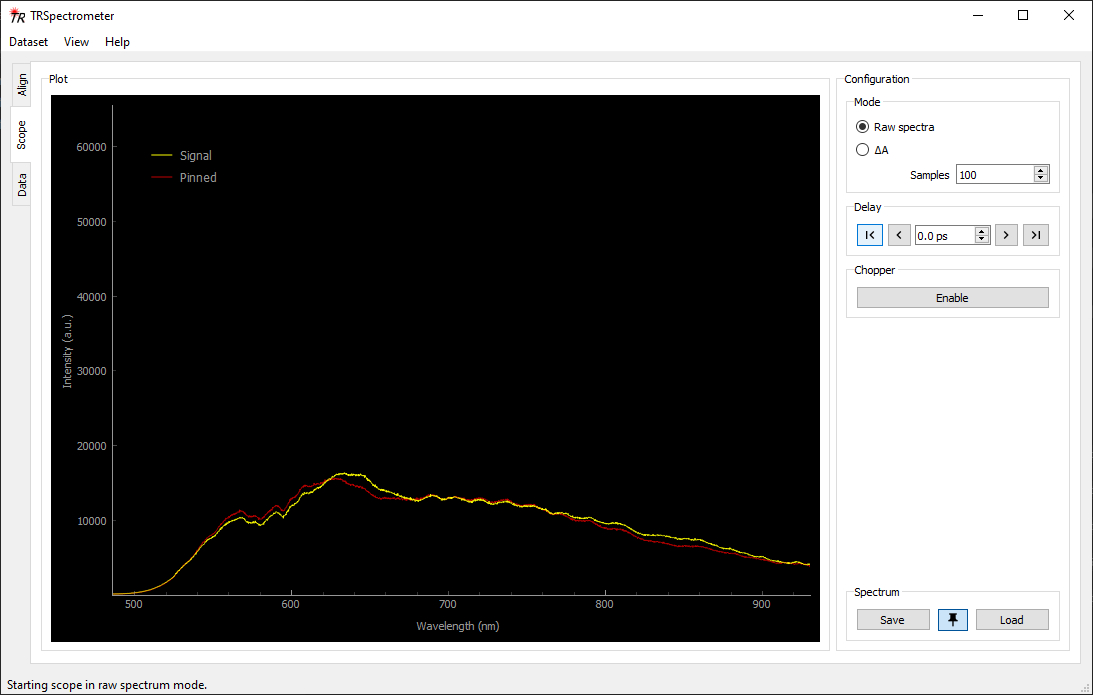
Scope panel showing a “pinned” spectrum (in red) used to check the stability of the continuum over the course of the delay. There is a small but acceptable change in the character of the spectrum between the start and end of the delay range.
If there is an unacceptable amount of change in the spectrum, it may be necessary to repeat some or all of the alignment steps listed in this section, for example, by checking the delay line passes again.
Check Signal Quality
Note that air currents and table vibration can have a significant effect on the stability of the white light. To properly evaluate the character of the continuum, the spectrometer lid should be on and a few seconds provided for things to settle.
Even when the raw spectrum appears stable, there can be momentary glitches and dropped pulses which can cause severe degradation of the acquired signal. It is worth checking the change in absorbance (ΔA) signal to ensure it looks good too.
Switch the scope to ΔA mode. There is no need for a sample or pump light to be present at this
stage. With no sample and/or no pump light, the signal should theoretically be zero. Of course, with
detector noise and laser fluctuations this will never be the case. At this point, what is considered
“good” is somewhat subjective and dependent on several factors such as the WLG medium type. If
excessive or extreme fluctuations are observed, try adjusting the intensity of the white light
slightly. Note that if the intensity is changed, the later alignment steps should also be checked.
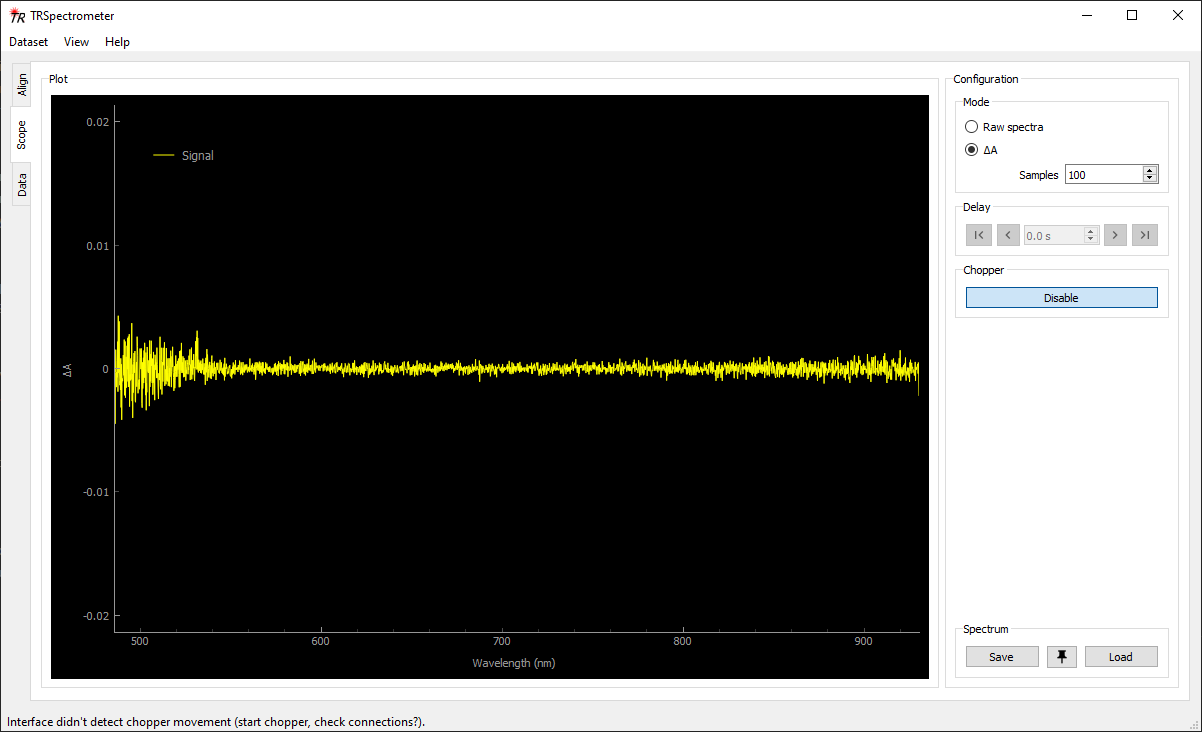
Scope panel showing a “blank” signal, with no sample or pump laser present. Ideally, the signal should be a flat, stable zero across the spectrum. The increased noise at the blue end of the spectrum is expected due to a low intensity of the white light probe in that region.
Saving Spectrum for Later Reference
Once an acceptable continuum is achieved, the spectrum can be saved for later reference. Switch the
scope to Raw mode, then click the Save button. Type a filename (or accept the default
suggestion).
Use the Load button to load a previously saved spectrum. The loaded spectrum will persist on the
plot until the Unload button is pressed (even between application restarts). With a loaded
spectrum for reference, it is easy to check if the alignment has drifted over the course of time.
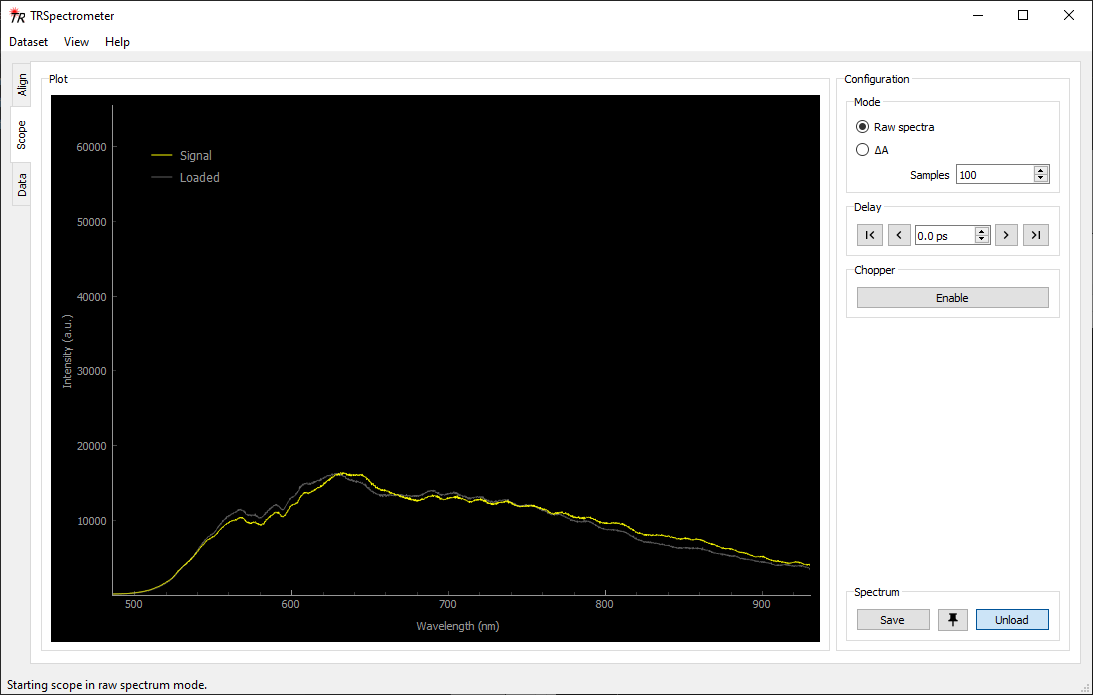
Scope panel showing a loaded spectrum (in grey) which remains on the plot for reference purposes.
Excitation (Pump)
Assuming that the pump laser is suitable for the experiment (appropriate wavelength, pulse duration), the alignment through the spectrometer is relatively straightforward. It simply needs to pass along the appropriate path, through the chopper wheel and onto the sample.
Beam Paths
Using the external steering mirror, direct the beam onto M8 and through the centre of the iris target (I3).
Use M8 to aim through the waveplate (WP2) and polariser (P2) onto M9 and iris target I4.
Use M9 to aim through the lens (L5) and chopper wheel (CW) onto iris target I5.
Repeat the above steps as needed until the beam passes cleanly though all the elements.
Use M10 to direct the pump beam so that it overlaps with the probe light at the sample position.
Spot Size and Pulse Energy
The position and/or focal length of the lens L3 can be adjusted to optimise the pump spot size at the sample position. The pump should be approximately 3× the size of the probe. The residual pump beam should hit the edge of the iris (I1) and be blocked.
The pump power can be adjusted using the neutral density filter wheel (ND) and/or the waveplate (WP2).
Pump and Probe Overlap
The pump beam needs to be properly overlapped with the probe at the sample position. This can be
optimised using the Scope panel in ΔA mode.
Place a sample into position. When using unknown or troublesome samples, using a test sample (eg. a dye which absorbs the same pump wavelength) can be helpful. This also allows high pump powers to be used without fear of damaging or degrading a real sample.
Switch to the Scope tab and select ΔA mode. Use the Delay controls to select a delay
time you know will be after time zero (the time when the pump and probe arrive simultaneously). If
your sample has a very short excited-state lifetime, then finding the correct time can be difficult
(again, an appropriate test sample can be useful here).
Adjust the steering mirror (M10) until the pump-probe overlap is optimised. It may be helpful at first to use a white card to trace the path of the beams onto the sample. Once a small signal is observed on the plot, make small adjustments of M10 until the magnitude of the signal is maximsed.
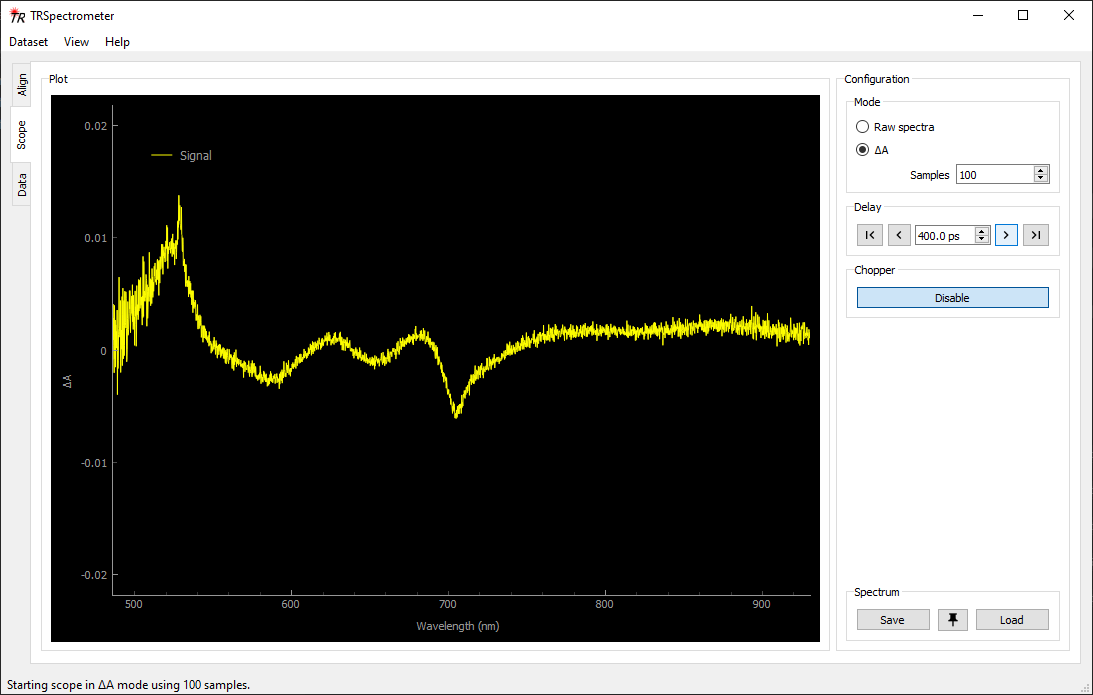
Scope panel showing a change in absorbance (ΔA) signal which should be maximised when optimising the pump probe beam overlap on the sample.
Find Time Zero
Use the Delay controls to reduce the delay time until the signal disappears. This is now “before
time zero”. Make smaller increments upwards until the signal reappears, and repeat until you narrow
down the time when the signal just starts to appear. Make a note of the time, as that is the time
zero for the current configuration of the spectrometer.
The < and > buttons will jump by a small amount, while the up and down arrows of the spin
box will make fine adjustments. A time can also be typed in directly into the spin box (press enter
to commit the change).